If you’ve ever watched financial news during a stock market sell-off, you’ve likely heard reporters mention a soaring VIX. But what is it exactly, and why should you care?
In the world of trading, the VIX is often called the “Fear Gauge.” When it goes up, investors are usually panicking; when it goes down, the market is typically calm and confident.
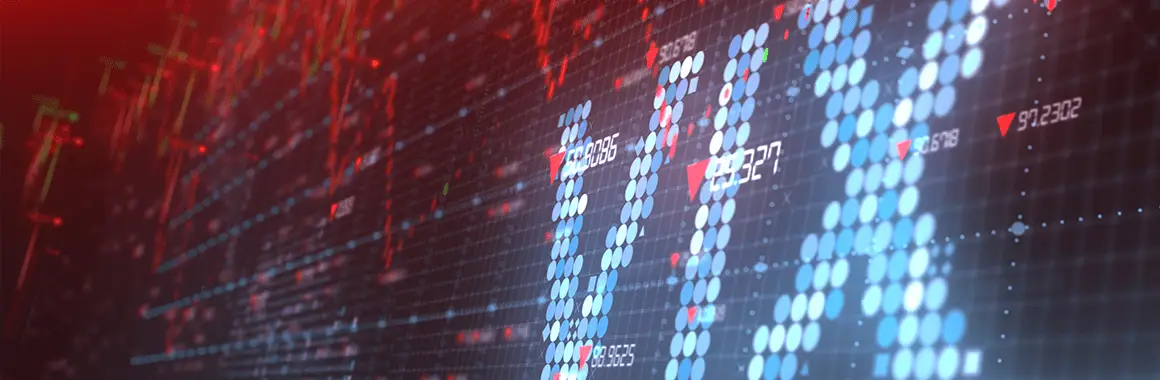
What is the VIX?
The VIX, officially known as the Cboe Volatility Index, is a real-time market index that represents the market’s expectation of 30-day forward-looking volatility.
Unlike the S&P 500, which tracks the price of 500 major companies, the VIX doesn’t track a price—it tracks uncertainty. It is calculated based on the prices of S&P 500 index options. When investors are worried about a market crash, they buy “insurance” (put options), which drives up the VIX.
How to Read the VIX Numbers
Think of the VIX like a speedometer for market anxiety. Here is a beginner-friendly cheat sheet for the levels you’ll see in early 2026:
| VIX Level | Market Mood | What it Means |
| Below 15 | Complacency | Investors are very calm; the market is usually rising steadily. |
| 15 – 25 | Healthy / Normal | Standard volatility for a healthy, functioning bull market. |
| 25 – 35 | High Stress | Uncertainty is rising. Expect sharp, nervous price swings. |
| Above 35 | Panic / Crisis | Extreme fear. Often seen during major global events or market crashes. |
Real-Time Example: January 2026
We don’t have to look far for a real-world example. Just last week, on January 20, 2026, the VIX provided a textbook signal of market stress.
As geopolitical tensions rose regarding new trade restrictions and the “Greenland Ultimatum,” the S&P 500 experienced its biggest drop since October, falling -2.1% in a single session. Simultaneously, the VIX surged past the 20.00 threshold, jumping nearly 28% in one day to close at 20.6.
This spike was a “warning siren” to traders that the calm “Goldilocks” environment of late 2025 had officially ended, and the cost of protecting portfolios was about to get much more expensive.
Why Beginners Should Watch the VIX
- Spotting “Bottoms”: Historically, extreme spikes in the VIX (above 40) often mark the end of a sell-off. As the saying goes: “When the VIX is high, it’s time to buy.”
- Risk Management: If the VIX is rising, it’s a signal to check your stop-losses. High volatility means prices will swing more wildly, and you could be “stopped out” of a good trade too early.
- Options Pricing: If you trade options, a high VIX means premiums are expensive. It’s a great time to be a seller of options, but a costly time to be a buyer.
Stay connected